
In the world of technical analysis and trading, understanding various candlestick patterns is crucial for making informed decisions. Among these patterns, the Marubozu candlestick is a significant one, known for its clear indications of market sentiment. This comprehensive guide will delve into the Marubozu candlestick pattern, explore its different types, and provide practical insights on how to use it effectively in trading strategies.
Understanding Marubozu Candlestick
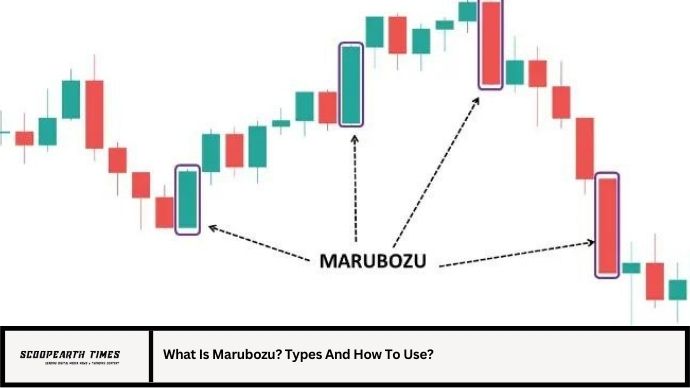
A Marubozu candlestick is a type of candlestick pattern characterized by its long body and minimal to no wicks or shadows. The term “Marubozu” is derived from a Japanese word meaning “bald head,” which refers to the candlestick’s appearance of having no or very little shadow, indicating strong momentum in one direction.
Characteristics of Marubozu
- Long Body: The Marubozu candlestick has a long body, meaning the difference between the opening and closing prices is significant.
- No Wicks or Shadows: Ideally, a Marubozu candlestick will have little to no wicks at the top or bottom, though some variations might have short wicks.
- Strong Trend Indicator: The absence of wicks suggests that the price moved strongly in one direction throughout the trading session.
Why Marubozu Matters
The Marubozu pattern is significant because it reflects strong buying or selling pressure during the trading period. This pattern can indicate a potential continuation or reversal of the trend, making it a valuable tool for traders looking to understand market dynamics.
Types of Marubozu Candlesticks
There are two primary types of Marubozu candlesticks: the Bullish Marubozu and the Bearish Marubozu. Each type provides different insights into market sentiment and potential future price movements.
2.1 Bullish Marubozu
A Bullish Marubozu appears in an uptrend and signifies strong buying pressure. It is characterized by the following features:
- Opening Price: The candlestick opens at the low of the period.
- Closing Price: The candlestick closes at the high of the period.
- Appearance: The body is long and filled, with no or minimal shadows.
2.2 Bearish Marubozu
A Bearish Marubozu appears in a downtrend and signifies strong selling pressure. It is characterized by the following features:
- Opening Price: The candlestick opens at the high of the period.
- Closing Price: The candlestick closes at the low of the period.
- Appearance: The body is long and filled, with no or minimal shadows.
How to Use Marubozu Candlesticks in Trading
Effectively using Marubozu candlesticks involves understanding their implications in various trading contexts. Here’s how you can incorporate Marubozu patterns into your trading strategy:
3.1 Identifying Trend Reversals
- Bullish Reversal: A Bullish Marubozu that appears at the end of a downtrend may signal a potential reversal. This pattern suggests that buyers have taken control and the price may start to rise.
- Bearish Reversal: A Bearish Marubozu that appears at the end of an uptrend may signal a potential reversal. This pattern indicates that sellers have taken control and the price may start to fall.
3.2 Confirming Trend Continuations
- Bullish Continuation: When a Bullish Marubozu forms during an uptrend, it can confirm the continuation of the trend. Traders might look for additional bullish signals or patterns to reinforce this confirmation.
- Bearish Continuation: When a Bearish Marubozu forms during a downtrend, it can confirm the continuation of the trend. Traders might look for additional bearish signals or patterns to reinforce this confirmation.
3.3 Combining with Other Indicators
Marubozu patterns are more reliable when combined with other technical indicators. For example:
- Volume Analysis: Confirming the Marubozu pattern with increased trading volume can validate the strength of the trend.
- Moving Averages: Use moving averages to determine the overall trend direction and validate the Marubozu pattern.
- Relative Strength Index (RSI): RSI can help assess whether the market is overbought or oversold, providing additional context to the Marubozu pattern.
3.4 Risk Management
- Stop Loss Orders: Implement stop loss orders to protect against adverse price movements when trading based on Marubozu patterns.
- Position Sizing: Adjust your position size based on the strength of the Marubozu signal and your risk tolerance.
Examples of Marubozu in Real Markets
To illustrate how Marubozu candlesticks work in real trading scenarios, let’s explore a few examples:
4.1 Bullish Marubozu Example
Imagine a stock that has been declining for several days. On the fourth day, a Bullish Marubozu forms with a long body and no shadows. This pattern suggests strong buying pressure and could indicate a potential bottom. Traders might look for additional bullish signals to confirm a buying opportunity.
4.2 Bearish Marubozu Example
Consider a stock that has been rising steadily. On the seventh day of the uptrend, a Bearish Marubozu forms with a long body and no shadows. This pattern suggests strong selling pressure and could indicate a potential top. Traders might look for additional bearish signals to confirm a selling opportunity.
4.3 Combining Marubozu with Moving Averages
Suppose a Bullish Marubozu forms in an uptrend while the stock price is above a 50-day moving average. The combination of the Marubozu pattern and the moving average supports the continuation of the uptrend. Traders might use this confirmation to enter or add to a long position.
Conclusion
The Marubozu candlestick pattern is a powerful tool in technical analysis, offering insights into market sentiment and potential price movements. Understanding the characteristics of Bullish and Bearish Marubozu patterns, and how to use them effectively, can enhance your trading strategy and decision-making process.
Incorporating Marubozu patterns into your trading arsenal involves recognizing their significance in trend reversals and continuations, combining them with other technical indicators, and practicing effective risk management. By doing so, you can leverage the Marubozu pattern to make more informed trading decisions and improve your overall trading performance.
FAQs
1. What does a Marubozu candlestick signify?
A Marubozu candlestick signifies strong momentum in one direction, with no or minimal shadows, indicating strong buying or selling pressure.
2. How do I identify a Bullish Marubozu?
A Bullish Marubozu is identified by its long body with the opening price at the low of the period and the closing price at the high, with no significant shadows.
3. What is the difference between Bullish and Bearish Marubozu?
A Bullish Marubozu appears during an uptrend and indicates strong buying pressure, while a Bearish Marubozu appears during a downtrend and indicates strong selling pressure.
4. How can I use Marubozu patterns in trading?
Marubozu patterns can be used to identify potential trend reversals or continuations. Combine them with other technical indicators for confirmation and practice effective risk management.
5. Are Marubozu patterns reliable for predicting market movements?
While Marubozu patterns provide valuable insights, they should be used in conjunction with other technical analysis tools and indicators to enhance reliability and accuracy.


